There is a cost your P&L does not show.
It does not appear on your income statement. It is not in your SG&A breakdown. No finance committee meeting has ever had a line item for it, and no budget review has ever put a number next to it. But it is real, it compounds every quarter, and in most mid-market and enterprise B2B companies, it is one of the largest operational inefficiencies in the business.
It is the cost of processing orders manually.
I want to be precise about what I mean. I am not talking about the obvious stuff: the headcount you already know is doing order entry, the customer service reps chasing down missing POs, the AR analyst reconciling mismatched line items. I mean the fully-loaded, cross-functional cost of a process that was designed for a world where fax machines were modern infrastructure and nobody thought twice about three people touching every sales order before it hit the ERP.
Most organizations know this cost exists in some vague sense. Very few have actually measured it. And that gap, between knowing the problem exists and understanding what it actually costs, is what allows it to persist.
This post is about closing that gap.

01: The Numbers Nobody Quotes at Budget Time
Let me start with the benchmarks that are actually defensible.
Ardent Partners surveys AP and finance professionals annually, and their most recent benchmark data, published in January 2026, gives the clearest current picture of where the market actually sits. The average cost to process a single invoice: $9.84. The average processing time: 8.2 days. Best-in-class organizations process invoices at costs 79% lower and cycle times 79% faster than their peers.[2]
Ardent attributes much of that gap to automation maturity and exception-handling discipline. I'd add my own read here, from running O2C teams: in my experience, the gap tracks less with company size or industry and more with whether leadership has actually funded the fix, but that's a field observation, not something the benchmark itself isolates.
Now extrapolate that to procurement and order management. Hackett Group's 2025 Digital World Class Procurement research shows the highest-performing procurement organizations operate at 19% lower overall cost, with 31% fewer FTEs, 2.6X greater ROI, and 58% shorter requisition-to-PO cycle times than their peers.[3] That's Hackett's benchmark for procurement organizations with mature digital, operating-model, and technology capabilities.
Then, in July 2026, Hackett went further. Their new AI World Class tier (a category above Digital World Class, built around organizations that have redesigned their purchase-to-pay process around AI rather than just automating the existing one) reports up to 80% lower process costs, up to 81% lower staffing requirements, up to 74% faster invoice processing, and a 76% reduction in invoice errors.[4]
Read that again: up to 80% lower process costs. Not 10%. Not 20%. Four-fifths of the cost, gone, in organizations that didn't just automate the old process, but rebuilt it around AI. That distinction matters, and I'll come back to it in Section 06, because "automate what exists" and "redesign around AI" are not the same project, and vendors routinely blur the line between them.
The APQC published research in 2017 that found fully manual sales order processing cost approximately $21 per order, compared to roughly $2 per order in highly automated environments.[5] That research is nearly a decade old (the oldest data point in this piece) and no updated study has re-measured this specific gap since. My own view, watching the pace of automation improve over the last decade, is that the gap has likely widened rather than narrowed. But that's my inference, not a benchmark.
Here's a hypothetical, not a benchmark: if your organization processes 10,000 orders per month at $15 per order in an average-automation environment, and best-in-class automation brings that to $4 per order, you are looking at $1.32 million per year sitting in the gap between where you are and where you could be. Those specific dollar figures are illustrative: I'm applying the shape of the benchmark gap to a round number, not quoting a study that measured sales-order costs at that precision. But the shape of it is real, and it's often large enough to justify a genuine business case for headcount reallocation or a technology investment. The actual case still needs your own numbers, not mine.
The reason it does not get measured is that nobody calls it "order processing cost." It gets called salaries, customer service headcount, IT overhead, and operations expense. It hides in plain sight across five or six cost centers, and the only way to see it is to decide to look for it.
02: The Exception Tax
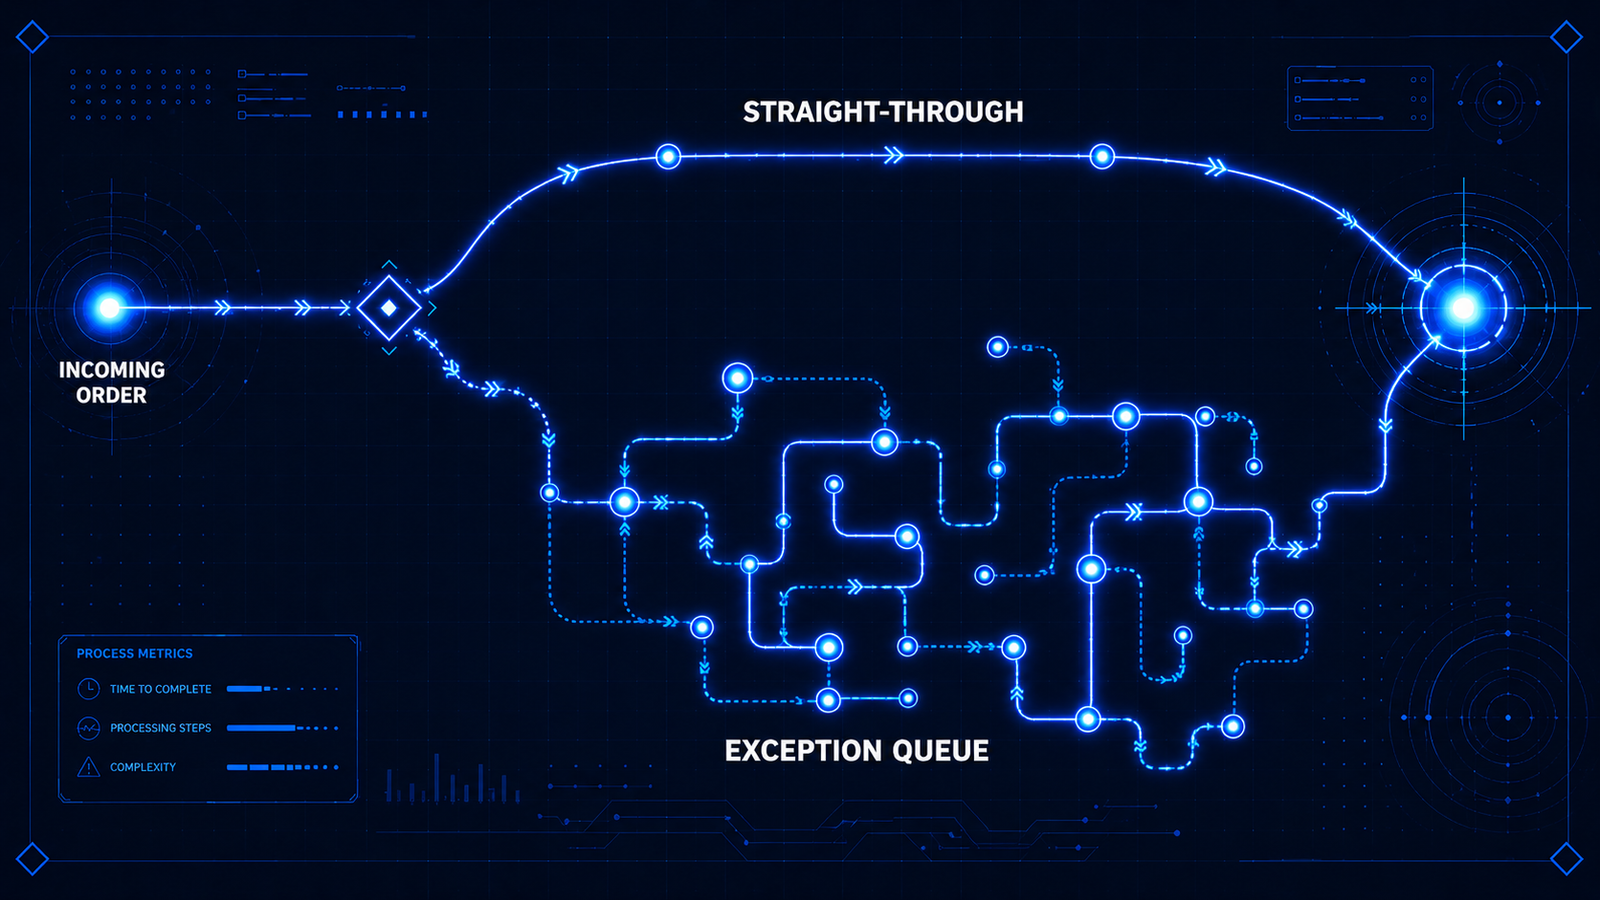
Here is the mechanism that drives most of the cost: exceptions.
An exception is any order that cannot be processed straight-through: any order that requires a human to intervene, investigate, correct, escalate, or re-key. In a well-automated environment, exceptions are rare. In a manual-heavy environment, they are the default.
Ardent's most recent data puts the average invoice exception rate at roughly 18% (the exact figure has moved a few points between report editions, but it's held in the mid-to-high-teens range for a while now).[2] That means something close to one in five invoices requires human intervention before it can be processed — not because the business is complex, but because the process is broken.
And here is what exceptions actually cost in time: the same research shows AP staff in average organizations spend roughly 22% of their working time handling supplier inquiries: status checks, clarification requests, "where is my payment" calls, and problem resolution. Best-in-class teams spend roughly half that.[2]
That gap (call it ten to eleven percentage points) is the exception tax. It is the toll your organization pays every week in lost productive capacity: time that could be spent on higher-value analysis, customer engagement, or cash flow management. Instead it goes to reactive firefighting on problems that, in a well-designed process, would not exist.
The pattern is the same on the order side. Clarasys's December 2024 O2C survey found that 52% of companies need to correct 26% or more of their invoices, and 34% experience delays in generating invoices after orders are dispatched.[6] I want to flag these two figures honestly: I wasn't able to independently corroborate them outside Clarasys's own published report. They're directionally consistent with everything else in this section, but treat the specific percentages with that caveat in mind.
And perhaps the most telling Ardent Partners finding, from their 2025 benchmark: only 32.6% of invoices are processed touchless: completely automated, no human involved. For best-in-class organizations, that number rises to 49.2%. For everyone else: 23.4%.[1] Ardent's newest update, published in January 2026, reframes this slightly: Best-in-Class organizations now process roughly 1.8 times as many invoices touchless as their peers, directionally the same story, expressed as a ratio rather than a fixed split.[2]
Think about what that means operationally. In the average organization, more than two-thirds of all invoices still require a human to touch them. Not because they are complicated. Because the process was not designed to handle them automatically. And every one of those human touches is a cost that does not appear on any P&L line item.
03: The Hidden Costs That Never Make the Meeting
The numbers above are the visible tip. The costs that most organizations completely miss are the indirect ones: the ones that require a different lens to see.
The customer churn signal hiding in your order error rate
Sana Commerce's 2024 B2B buyer survey (fieldwork conducted by independent research firm SAPIO across 1,000 professional buyers, though commissioned and published by Sana) found that 33% of online B2B orders contain errors. That is up from 28% in 2019. It is moving in the wrong direction.[7]
The downstream consequence: 68% of buyers are discouraged from ordering online because of order errors. Sana's 2025 buyer report (vendor-sponsored, same fieldwork model) found that 75% of B2B buyers would consider switching suppliers for a better buying experience.[8]
Read that in the context of your own order error rate. If one in three of your online orders contains an error, and three-quarters of your buyers would leave for a cleaner experience, your order management process is not just an operational problem. It is a revenue retention problem. It is sitting directly in the path of your renewal rate, your net revenue retention, and your customer lifetime value, none of which shows up in the "order management cost center."
The upstream data problem nobody wants to own
An older but structurally important analysis from the same 2018 APQC-Esker research breaks down the causes of manual sales order interventions: 25% from invoicing issues, 20% from pricing errors, 18% from contract discrepancies, 15% from incorrect customer master data, and the remaining 20% from other causes.[5]
That breakdown has a critical implication: most of the manual work in order management is not actually order processing. It is data surgery: correcting upstream errors in customer master data, pricing tables, and contract terms that should have been right before any order was placed.
Which means that deploying an order automation tool on top of a broken data foundation will not solve the problem. It will automate the detection of the same errors that humans are currently catching manually, route them to a different exception queue, and produce the same throughput at a slightly lower labor cost. The root fix is upstream: clean customer master data, current pricing configurations, and contract terms that are accessible at the point of order entry.
McKinsey's work with a large medical distributor (a company processing over 150,000 orders daily) found that when supply chain disruptions hit, pricing discrepancy errors tripled, overwhelming the manual exception-handling capacity that had seemed adequate under normal conditions.[9] I'll note this is a single narrative case study from a 2022 article, not a benchmark, and I haven't been able to independently re-verify the specific figure. Treat it as illustrative of the mechanism, not proof of its frequency. The fragility it points to was always there. It took stress to make it visible.
The working capital cost your treasury team does not connect to order management
The connection between order management quality and cash conversion cycle length is real but underappreciated in most organizations.
Hackett Group's 2025 U.S. Working Capital Survey found the cash conversion cycle now at 37 days (a 4% year-over-year improvement) with $1.7 trillion in excess working capital (roughly 35% of gross working capital, 11% of aggregate revenue) still trapped across the top 1,000 U.S. public nonfinancial companies.[10] In Europe, the picture is worse: Hackett's 2025 European survey found the CCC worsened by 3% in 2024, with €1.4 trillion in identified working capital improvement opportunity.[11]
Clarasys's 2024 survey adds specificity: 51% of businesses are waiting more than 60 days to collect payment.[6] Not 60-day terms: 60-day actual collection. The gap between terms and reality is where the working capital bleeds.
Now trace the mechanism: a delayed or inaccurate order creates a delayed or inaccurate invoice. A delayed invoice creates a delayed payment. A delayed payment extends DSO. Extended DSO means more working capital tied up in receivables, less cash available for operations or investment, and more exposure to bad debt. The chain from "we sent the order acknowledgment two days late with the wrong price" to "we have $4 million more in receivables than we should" is not a hypothesis. It is a process flow diagram.
04: Why the CFO Does Not See This
If the cost is this significant, why does it not appear in the board deck?
BCG's 2025 research on organizational cost challenges offers a structural explanation: 80% of senior leaders and 67% of middle managers cite the absence of clear P&L ownership for operational costs as a key driver of cost creep in their organizations.[12]
Order management is the textbook case. The costs are distributed across customer service salaries (SG&A), operations headcount (COGS or OpEx), IT infrastructure (IT budget), and lost revenue from churn and errors (revenue line, not cost line). No single owner is accountable for the total cost. No single report surfaces the aggregate number. And so no single leader is standing in front of the CFO saying "we are spending $X per order more than we should be."
The problem compounds at budget time. Headcount-based costs are treated as fixed: you cannot reduce five FTEs without a restructuring event, which requires a business case, which requires the number that nobody has calculated. Technology investment requires capital approval, which requires the same number. The result is a self-reinforcing status quo: the cost is too diffuse to measure, too diffuse to own, and therefore too diffuse to fix.
The practical shift required is what Supply & Demand Chain Executive described in 2025 as reframing order management from "back-office cost center" to "profit driver."[13] The order is not just a transaction to be processed. It is the point where customer relationship data, pricing accuracy, fulfillment reliability, and cash conversion all intersect. Getting it wrong costs far more than the labor to process it correctly. Getting it right unlocks margin, retention, and cash flow simultaneously.
That framing (order accuracy as a revenue and retention lever, not just an efficiency metric) is the one that gets a CFO's attention.
05: The Scale of the Problem: How Much Is Still Manual?
The honest answer is: more than most technology budgets would suggest, though the trend line is more mixed than it looked a year ago.
Modern Materials Handling's January 2025 Automation Survey found that 52% of warehouse and distribution center operations remained mostly or entirely manual for order fulfillment, up from 43% the prior year, which at the time read like a genuine regression. Their newer 2026 Automation Study changed how it measures this, reporting automation levels process-by-process (picking, storage, retrieval, packaging, labeling) rather than a single manual/automated split, and the picture it shows is more mixed: full automation is still low across core fulfillment steps (12% for picking, 11% for storage, just 3% for retrieval), but several processes ticked up modestly year over year rather than continuing to slide.[14] I'm not going to claim the 2025 regression was a blip, or that automation investment has "stalled or reversed" — the newer survey doesn't clearly support that narrative either way, and I'd rather flag the ambiguity than force a clean story the data doesn't back.
Zone & Co's 2024 State of Finance Automation survey (200+ CFOs and finance leaders) found approximately 70% of finance leaders describe their order-to-cash systems as only partially connected, with heavy reliance on spreadsheets and email to bridge gaps.[15] Partially connected means humans are still doing the bridging — keying data from one system into another, reconciling outputs that should reconcile automatically, and making judgment calls that should be made by rules.
SSON's "Future of Order-to-Cash" market research reports that 78% of organizations say they are focused on automating O2C, but manual processes remain their most frequently cited pain point.[16] I wasn't able to independently corroborate that specific figure outside SSON's own gated report, so treat it as directional rather than confirmed. Even so, the pattern is a familiar one: high stated priority, persistent manual reality: the hallmark of a problem that gets declared many times and solved rarely.
The industries most exposed are predictable: manufacturing, wholesale distribution, and industrial products. These businesses typically process high volumes of line-item-rich purchase orders from multiple channels (EDI, email, customer portals, PDF, and occasionally still fax) and they often run on legacy ERPs that were not designed for the kind of API-level integration that modern automation requires. Their order complexity is high, their data standardization is low, and their manual intervention rates reflect both.
06: What Automation Actually Solves (and What It Does Not)
Let me be direct about what is realistic in 2026, because this space has its share of overpromising. This is also where the Hackett distinction from Section 01 matters most: there's a real difference between automating your existing order management process and redesigning it around AI, and most of what's realistically achievable today falls into the first category, not the second.
The tasks that are reliably automatable today (not in theory, in production) include:
- Order capture from emailed PDFs, customer portals, and EDI using Intelligent Document Processing. This is a solved problem with known vendors and proven track records. The technology reads the order, extracts the data, maps it to your internal SKUs and pricing, and validates it against customer master data without human involvement in the straight-through cases.
- ERP entry of validated order data. Once captured and validated, entering the order into your ERP via API or integration is fully automatable. The human bottleneck here is almost always data quality upstream, not the entry task itself.
- Pricing and discount validation against contract terms and customer master data. This is where most exceptions originate, and it is also where automated validation catches errors before they become manual corrections downstream.
- Order acknowledgment and status communication. Automated, templated, and triggered by workflow rules. No reason for a human to be typing these.
- Exception categorization and routing. Not all exceptions require the same response. Automated classification (routing pricing errors to the pricing team, SKU mismatches to the catalog team, credit exceptions to credit management) reduces the time each exception sits in an undifferentiated queue.
- Cash application and remittance matching. ML-based matching of incoming payments to open invoices. The technology here is mature and widely deployed. If you have not automated this yet, it is almost certainly the highest-ROI automation investment available to you in O2C.
What does not automate cleanly yet: nuanced customer relationship management in high-stakes accounts where tone judgment matters more than process efficiency, complex multi-party disputes that require negotiation and commercial judgment, and any automation built on top of poor data. The technology cannot compensate for master data that is wrong — it can only process it faster and fail more efficiently.
07: What the Realistic STP Numbers Look Like
Vendors will show you 80–95% straight-through processing rates. Those numbers come from their best-performing customers, in well-structured high-volume environments, after significant implementation and data-cleaning work.
The independent benchmark is more sobering: Ardent's 2025 data puts the average touchless invoice rate at 32.6%, with best-in-class at 49.2%.[1] That is the real baseline for organizations with automation already in place.
Vendors like Esker and Conexiom publish touchless/STP figures in the 67–95% range across their own customer bases. These are vendor-reported figures: I was not able to independently confirm current, dated collateral restating those exact numbers as of this writing, so treat them as directional marketing claims rather than audited benchmarks. One disclosure worth noting: Esker was taken private by Bridgepoint and General Atlantic in early 2025 and delisted from the public markets.[17] That doesn't change what their platform does, but it's worth knowing when you're treating a vendor as an independent reference point.
If accurate, these vendor-reported figures describe outcomes within their own customer populations. They should not be used as a first-year planning benchmark without validating the underlying methodology, customer mix, implementation period, and definition of straight-through processing.
My own planning assumption, based on watching these rollouts in practice rather than any single published benchmark, for organizations moving from limited automation to a modern IDP-plus-workflow stack: 40–60% straight-through processing in year one, scaling toward 65–75% as data quality improves and the exception logic matures. Treat this as a directional target to validate against your own data, not a market-wide benchmark. The 80%+ numbers are achievable but they are the output of sustained investment, not the starting point.
08: The ROI Reality Check
The payback period question is where the conversation usually gets uncomfortable.
For narrow, high-volume use cases — cash application automation, invoice processing, order acknowledgment — my own estimate, based on the cost-reduction percentages in Ardent's benchmark data, is a 4–6 month payback timeline under favorable assumptions: at the cost reduction Best-in-Class organizations achieve, typical mid-market invoice volumes could generate enough annual savings to cover implementation cost in under a year. That's my derivation from the benchmark data under those assumptions, not a study that measured payback periods directly.
For broader O2C or order management automation programs — where you are touching order capture, ERP integration, exception management, and customer communications — a vendor-cited planning scenario (worth validating against your own numbers) puts the range at 12–18 months to full payback, assuming competent implementation and an organization that does the data-quality work upstream. This range comes from vendor content rather than independent research.[18]
The variable that matters most is not the technology. It is the data and change management investment that surrounds the technology. Clearomni (a vendor/consulting firm, and this figure has not been independently corroborated) reports that 44% of automation projects fail due to poor change management, not technology problems, with an additional 42% citing integration challenges with existing systems.[19]
That finding, if directionally accurate, reframes the ROI calculation. The budget line you should be protecting is not the software license. It is the implementation support, data migration, process redesign, and training investment that determines whether the software generates the stated value. Organizations that underinvest in those surrounding elements consistently see longer payback periods, lower STP rates, and higher exception volumes, and conclude that automation "did not work" when the problem was never the automation.
09: The Practical Starting Point
If you are reading this as an O2C or finance leader and wondering where to start, I would suggest a simpler first step than a vendor evaluation.
Calculate your current cost per order. Not an estimate. An actual calculation: total labor cost of everyone who touches an order from receipt to ERP entry, divided by monthly order volume. Then add the cost of exceptions: time spent on corrections, reprocessing, customer communication, credits, and returns. Then add the revenue impact of your order error rate on retention.
Most organizations that do this exercise for the first time are surprised by the number. It is almost always higher than the intuitive estimate, because the costs are fragmented across teams and functions and nobody has ever added them up before.
That number is your business case. It is also the number that makes a technology investment look obvious rather than speculative.
The second step is a data quality audit before you talk to a single vendor. Know your customer master data accuracy rate. Know your pricing configuration error frequency. Know your average exception rate by order type and channel. Those numbers will determine what automation can realistically achieve for you, and they will protect you from overpaying for a capability your data cannot yet support.
The third step is to start narrow. Cash application automation has the clearest ROI, the shortest implementation timeline, and the lowest data quality dependency of any O2C automation investment. If you have not done it, start there. The learnings (about your data, your exception patterns, your team's capacity to change) will inform everything else you do.
10: The Cost You Have Been Carrying
Manual order management is not a technology problem. It is a measurement problem.
The cost exists. It has always existed. It compounds every quarter in inefficiency, every exception in staff time, every order error in customer attrition. The organizations closing the gap are not doing anything exotic: they are applying technology that has been mature for several years to processes they finally decided to measure.
The benchmark is clear: Best-in-Class AP teams processing invoices at costs 79% lower than their peers. Hackett's AI World Class modeling indicates that purchase-to-pay process costs can decline by up to 80% when organizations redesign processes around AI. Those are not aspirational numbers from a vendor slide deck. Those are Ardent Partners and Hackett Group measuring the delta between organizations that have made the investment and those that have not.
The question for every O2C leader reading this is not whether the gap exists. The question is whether you know how big yours is.
References
- Ardent Partners — "AP Metrics that Matter in 2025" (State of ePayables 2024 survey, 212 respondents; via Apexanalytix, Feb 2025) — https://www.apexanalytix.com/resources/blog/ardent-partners-key-ap-metrics-2025/
- Ardent Partners — "State of ePayables (Part Nine): AP Benchmarks and Best-in-Class Performance" (Jan 21, 2026 update) — https://payablesplace.ardentpartners.com/2026/01/state-of-epayables-part-nine-ap-benchmarks-and-best-in-class-performance/
- Hackett Group — "Digital World Class® Procurement Teams Achieve 2.6X Higher ROI" (2025 research, Jul 14, 2025) — https://www.thehackettgroup.com/the-hackett-group-digital-world-class-procurement-teams-achieve-2-6x-higher-roi/
- Hackett Group — "The Hackett Group® Establishes AI World Class Procurement Benchmarks" (Jul 13, 2026) — https://www.thehackettgroup.com/the-hackett-group-establishes-ai-world-class-procurement-benchmarks/
- APQC / Esker / Redmap — Sales Order Automation research (2017–2018; pre-2024, directional) — APQC/Esker 2017 | Redmap/APQC/Esker 2018
- Clarasys — "Key insights and trends to transform your order-to-cash processes" (Dec 2024; specific figures not independently corroborated outside vendor site) — https://clarasys.com/en-us/insights/thinking/key-insights-and-trends-to-transform-your-order-to-cash-processes
- Sana Commerce / SAPIO Research — B2B buyer survey (2024) — https://www.digitalcommerce360.com/2024/03/11/sana-commerce-survey-b2b-sellers-online-buyers-error-prone-order-processing/
- Sana Commerce — B2B Buyer Report 2025 (vendor-sponsored, third-party executed) — Report | Announcement
- McKinsey — "Finding hidden value with order-to-cash optimization" (2022; pre-2024, single case study, narrative only) — https://www.mckinsey.com/capabilities/operations/our-insights/finding-hidden-value-with-order-to-cash-optimization
- Hackett Group — 2025 U.S. Working Capital Survey — https://www.thehackettgroup.com/2025-working-capital-survey-payables-rebound-receivables-inventory-lag/
- Hackett Group — 2025 European Working Capital Survey — https://www.thehackettgroup.com/2025-europe-working-capital-survey-cash-cycle-deterioration/
- BCG — "The Four Biggest Organizational Cost Challenges" (2025) — https://www.bcg.com/publications/2025/four-biggest-organizational-cost-challenges
- Supply & Demand Chain Executive — "From Cost Center to Profit Driver: Rethinking Order Management" (2025) — https://www.sdcexec.com/sourcing-procurement/procurement-software/article/22951854/cavallo-from-cost-center-to-profit-driver-rethinking-order-management
- Modern Materials Handling / Peerless Research Group — "2026 Automation Study: Warehouse automation ticks upward" (~Dec 2025–Jan 2026) — LinkedIn | Made4net
- Zone & Co — 2024 State of Finance Automation Survey (vendor-produced) — https://www.zoneandco.com/newsroom/zone-co-releases-2024-state-of-finance-automation-survey-results-highlighting-the-cost-of-inefficiencies-in-order-to-cash-processes
- SSON — "Future of Order-to-Cash Market Report" (2024/2025; specific figure not independently corroborated, gated report) — https://www.ssonetwork.com/finance-accounting/reports/future-of-order-to-cash-market-report
- Bridgepoint / General Atlantic — Esker take-private and delisting from Euronext Growth Paris (Feb–Mar 2025) — https://www.bridgepointgroup.com/about-us/news-and-insights/press-releases/2025/announcing-squeeze-out-of-esker
- Zoey — "Order Management 101: What Distributors Actually Need to Know" (2025; vendor content — payback-period framing in Section 08 is the author's own estimate informed by this and Ardent cost data, not a direct payback-period study) — https://www.zoey.com/order-management-101-what-distributors-actually-need-to-know-2025-edition/
- Clearomni — "AI in Order Management: 2026 Trends, Benchmarks & Implementation" (Jan 2026; vendor/consulting, not independently verified) — https://clearomni.com/blog/ai-in-order-management-2026-trends-benchmarks-implementation-1